When a drug hits the market, clinical trials are already behind it. Thousands of patients have taken it, but the real risks only show up when millions start using it. That’s where the FDA’s Adverse Event Reporting System, or FAERS, comes in. It’s not a secret system. It’s not locked behind paywalls. It’s public. And if you know how to use it, you can spot warning signs before they become crises.
What is FAERS, and why does it matter?
FAERS stands for the FDA Adverse Event Reporting System. It’s the largest database in the U.S. tracking side effects, overdoses, and other safety issues linked to approved drugs and biologics. Since 1969, it’s collected over 30 million reports. Each year, about 2 million more are added. These aren’t lab results or controlled studies. They’re real-world stories from doctors, pharmacists, patients, and drug makers.
Think of it like a national early warning system. If a new heart medication starts causing a rare type of stroke in 1 in 10,000 users, clinical trials might miss it. But FAERS can catch it - if someone reports it. The system doesn’t prove cause and effect. It flags patterns. Then the FDA investigates.
What makes FAERS unique? Unlike Europe’s EudraVigilance, which hides individual reports, or the WHO’s VigiBase, which is global but hard to navigate, FAERS gives you direct access. You don’t need special clearance. You don’t need a university login. You just need to know where to look.
The three ways to access FAERS data
You don’t need to be a data scientist to use FAERS. But you do need to know which tool fits your needs.
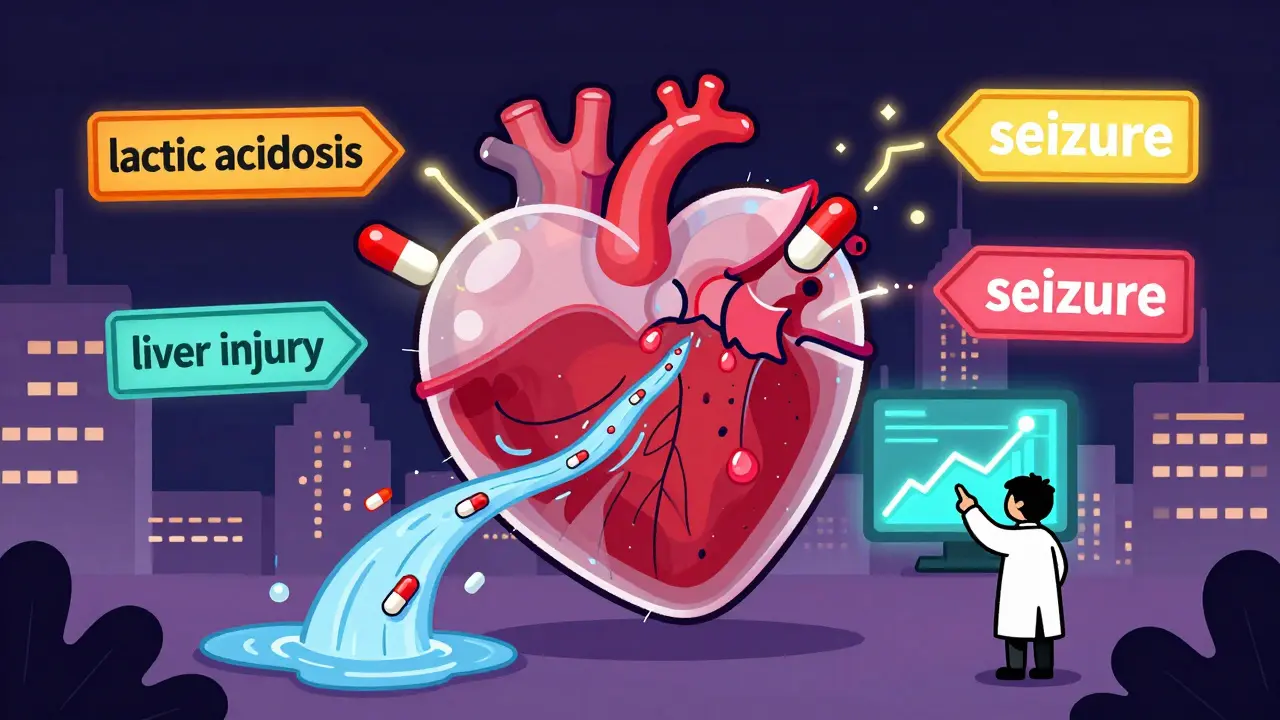
- FAERS Public Dashboard - This is the easiest place to start. Launched in 2023, it’s a web-based tool that lets you search by drug name, adverse event, age group, or gender. Type in “metformin” and “lactic acidosis,” and you’ll see how many reports came in each quarter. No coding. No downloads. Just charts and filters. It’s designed for patients, advocates, and journalists.
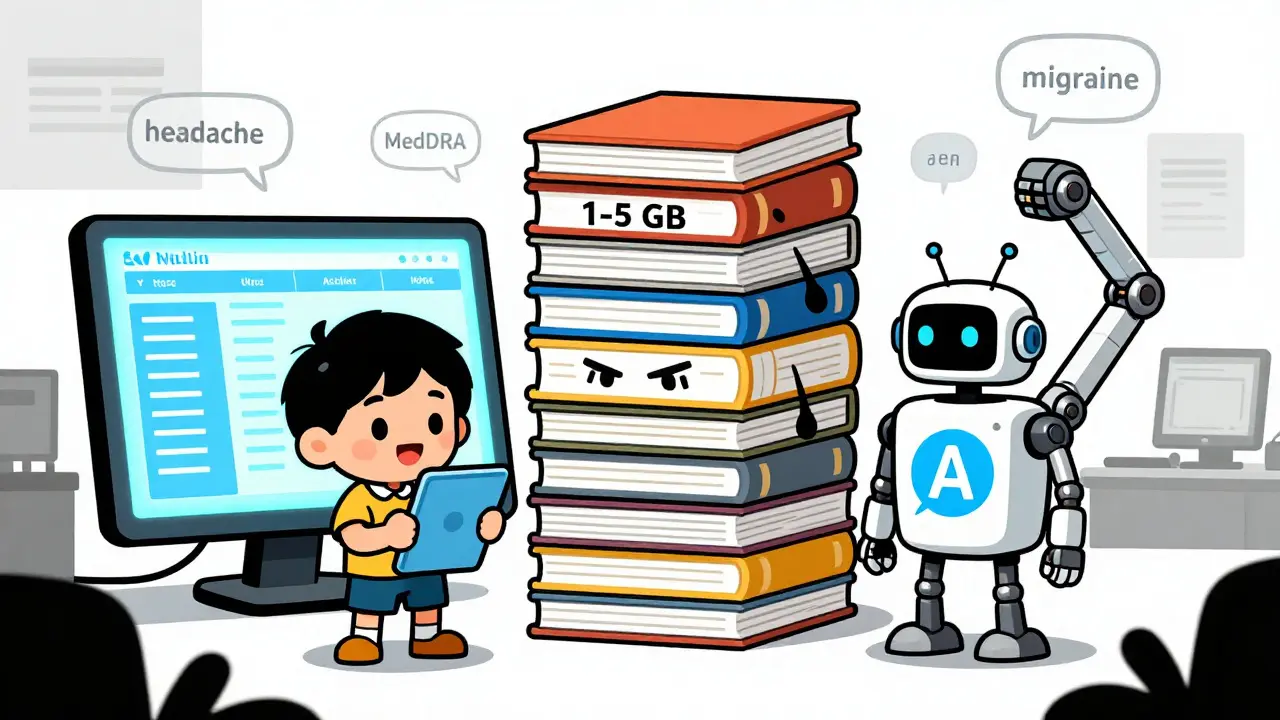
- Quarterly Data Extracts - These are raw files (ASCII or XML) released every three months. Each file is 1-5 GB. You’ll need software like R, Python, or Excel to open them. These are for researchers, grad students, or anyone who wants to run their own analysis. The data includes patient initials, drug names, dates, and MedDRA-coded adverse events - but not full names or addresses. Privacy is protected.
- OpenFDA API - If you’re building an app or automating reports, this is your tool. It returns JSON data you can pull into your own system. You can query for all reports of “liver injury” linked to “statins” in 2024. It’s powerful, but only if you know how to write basic API calls.
Most people start with the Public Dashboard. It’s free, intuitive, and updated quarterly. But if you’re doing academic research, you’ll eventually need the raw extracts. And if you’re building a safety monitoring tool for a nonprofit or startup, the API is the way to go.
What you can - and can’t - learn from FAERS
FAERS is powerful, but it’s not perfect. Here’s what it tells you:
- Which drugs are linked to more reports of a specific side effect
- Whether certain age groups or genders report more issues
- How often a problem shows up over time
- Which drugs are being reported together (possible interactions)
Here’s what it doesn’t tell you:
- How many people took the drug (so you can’t calculate true risk)
- Whether the side effect was actually caused by the drug
- How severe the event was - many reports just say “nausea” without details
- Whether the patient had other conditions or took other meds that caused the issue
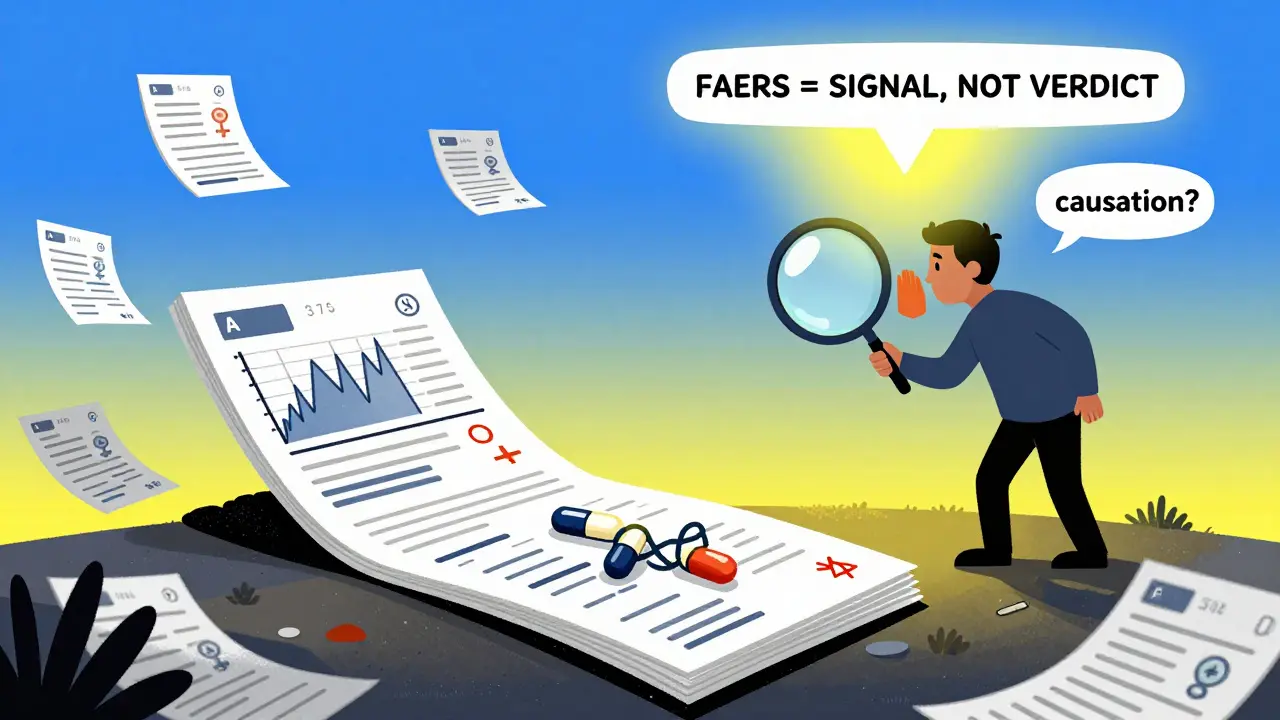
That last point is critical. A patient takes a new blood pressure pill and has a seizure. They also have epilepsy and stopped taking their anti-seizure meds. FAERS might list the blood pressure pill as the cause - but the real trigger was the missed dose. This is why the FDA says: “FAERS data by themselves are not an indicator of the safety profile of the drug.”
It’s a signal, not a verdict. You need context.
How experts really use FAERS
Academics at Johns Hopkins and Columbia use FAERS to find hidden patterns. One 2021 study in Nature Medicine used machine learning on FAERS data to uncover a link between a common antidepressant and a rare form of liver damage - a connection no one had noticed before. That led to updated prescribing guidelines.
Drug companies use FAERS too. Every major pharmaceutical firm in the top 50 has a team that pulls FAERS data daily. They don’t use the Public Dashboard. They use automated systems that scan for spikes in reports. If a new diabetes drug suddenly has 50% more kidney failure reports than last quarter, they have to notify the FDA within 15 days.
Patient groups have used FAERS to push for change. In 2022, a coalition of diabetes advocates used FAERS data to show that a popular antidepressant increased the risk of dangerous blood sugar drops in older adults. The FDA reviewed the data and added a warning to the label.
But here’s the catch: 30% of reports are incomplete. Missing dates. Wrong drug names. Unclear outcomes. That’s why experts say it takes 40-60 hours to learn how to read FAERS data properly. You need to understand MedDRA - the standardized medical terminology used to code every adverse event. “Headache” and “migraine” are separate codes. “Fatigue” and “lethargy” are different too. Get it wrong, and your analysis is garbage.
Common mistakes and how to avoid them
People make the same mistakes over and over:
- Confusing association with causation - Just because 100 people reported dizziness after taking Drug X doesn’t mean Drug X caused it. Maybe they were dehydrated. Maybe they had low blood sugar. Always look at the bigger picture.
- Ignoring reporting bias - Serious events get reported more. Patients report side effects they think are scary. Doctors report hospitalizations. Mild side effects? Often ignored. That skews the data.
- Not checking the date - FAERS data is updated quarterly. If you’re using 2023 data in 2026, you’re missing 15 months of reports. Always use the latest release.
- Overlooking concomitant drugs - Many reports list 3-5 medications. The problem might not be the one you’re looking at. You have to untangle what was taken together.
Pro tip: Use the Public Dashboard to explore, then download the raw data to dig deeper. Compare trends over time. Look for spikes after a drug’s launch or after a new warning label. If a side effect jumps from 20 reports to 150 in one quarter - that’s worth investigating.
What’s coming next?
The FDA isn’t resting. In January 2024, they switched to the ICH E2B(R3) standard, which means reports now include more structured data - like exact dosages and start/stop dates. That’s a big upgrade.
By late 2024, they plan to release an API that lets you query the dashboard’s analysis tools directly. No more downloading files. Just ask for “all reports of pancreatitis linked to Ozempic since 2022,” and get a clean JSON response.
By 2027, the FDA wants to link FAERS data with real-world health records - insurance claims, EHRs, pharmacy logs. That could finally answer the biggest question: How many people actually took this drug? Until then, FAERS remains a powerful but incomplete tool.
How to get started today
Here’s a simple roadmap:
- Go to the FAERS Public Dashboard (FDA’s official site)
- Search for a drug you’re curious about
- Filter by adverse event, age, or gender
- Look for trends - is the number of reports rising?
- If you see something unusual, download the quarterly data extract for deeper analysis
- Use free tools like Python’s Pandas library or R to clean and visualize the data
There are no fees. No login. No waiting. The data is yours to explore.
Just remember: FAERS doesn’t give you answers. It gives you questions. And sometimes, asking the right question is the first step to saving lives.
Is the FAERS database free to use?
Yes. All public tools - the FAERS Public Dashboard, quarterly data extracts, and the OpenFDA API - are completely free. No subscription, no login, no payment required. The FDA provides this data as part of its public health mission.
Can I find out who reported an adverse event?
No. Personal information like names, addresses, and exact birth dates are removed from all public data. Reports are anonymized to protect privacy. You’ll only see initials, gender, and age range. This is required by federal privacy laws.
How often is FAERS data updated?
The FDA releases new data every three months - in March, June, September, and December. The Public Dashboard updates at the same time. If you’re using the data for research, always check the release date on the download page to make sure you’re using the most recent version.
Do I need programming skills to use FAERS?
Not to use the Public Dashboard - it’s designed for anyone. But if you want to analyze raw data files (the 1-5 GB extracts), you’ll need basic programming skills. Tools like Python or R are recommended. There are free online tutorials that teach you how to load and filter FAERS data in under an hour.
Why do some drugs have way more reports than others?
It’s not always about safety. Drugs taken by millions - like aspirin or metformin - naturally have more reports. Newer drugs also get more attention. A drug just launched last year will have more reports simply because it’s being used more and people are watching for side effects. Always compare reports to usage volume - which FAERS doesn’t provide - to avoid false alarms.
Comments
Jason Pascoe
Just used the FAERS dashboard for the first time after reading this. Looked up metformin and was shocked at how many reports of lactic acidosis popped up in the last year. Not saying it’s dangerous, but it’s definitely worth a deeper dive. Thanks for the roadmap - this is the kind of info that should be mainstream.
February 13, 2026 at 16:33
Sophia Nelson
This whole thing is a joke. The FDA doesn’t care about patients. They’re just covering for Big Pharma. I’ve seen people die from side effects that never made it into these reports. This is all smoke and mirrors.
February 15, 2026 at 01:59
Skilken Awe
Oh wow, another ‘educational’ post about FAERS. Let me guess - next you’ll tell us to ‘check the MedDRA codes’ and ‘control for confounders.’ Newsflash: most people don’t have a biostatistics degree. This isn’t empowerment, it’s gatekeeping dressed up as transparency. The dashboard is a toy. The real data? Still locked behind 500GB of CSV hell. Great job, FDA.
February 16, 2026 at 02:33
Robert Petersen
Man, this is actually super helpful. I’m a med student and I’ve been trying to figure out how to use this stuff without drowning in jargon. The dashboard is legit - I used it to check out a drug my grandma’s on. Found 30+ reports of confusion in elderly users. Scary stuff. Now I know where to look before I prescribe anything. Thanks for breaking it down.
February 16, 2026 at 23:08
Craig Staszak
Love that this is free and open. I’ve been digging into FAERS for my nonprofit’s drug safety project and the API is a game changer. Just wrote a script to flag spikes in liver injury reports for GLP-1 drugs. We’re gonna publish it next month. If you’re not using this data you’re sleeping on public health
February 18, 2026 at 16:11
alex clo
The FAERS database is an invaluable public resource. Its structured reporting format enables epidemiological surveillance at an unprecedented scale. I would encourage all healthcare professionals to familiarize themselves with its methodology, particularly the limitations surrounding causality inference and underreporting bias. Proper utilization requires methodological rigor.
February 20, 2026 at 10:21
Alyssa Williams
OMG I just searched for Ozempic and saw like 500+ pancreatitis reports in 2024 alone 😱 I thought it was just me but this is wild. I’m gonna share this with my diabetic aunt. She’s scared of the drug but now she has real data. Thank you for making this so easy to understand!!
February 20, 2026 at 19:03
Ernie Simsek
YOOOOO I used FAERS to check my anxiety med and found 1200+ reports of ‘agitation’ - turns out I’m not crazy, the drug is just trash 🤡 I made a TikTok about it and it blew up. 10k views. FDA should pay me. Also here’s my dashboard screenshot 📸
February 21, 2026 at 16:27
Joanne Tan
So I spent 3 hours on the dashboard and found something weird - my mom’s blood pressure med had a spike in falls after 2022. We checked her pills and turns out the generic changed manufacturers. I called the pharmacy. They didn’t even know. This tool saved my mom. You guys need to tell more people about this.
February 22, 2026 at 16:37
Reggie McIntyre
This is the kind of thing that makes me believe in public institutions again. I used to think all government data was buried under bureaucracy. But FAERS? It’s like the internet’s version of a detective’s notebook - raw, messy, but full of truth. I spent a weekend mapping out all the antidepressant reports linked to weight loss. Found a pattern no one’s talked about. It’s not just about drugs - it’s about how we listen. And honestly? It’s beautiful.
February 24, 2026 at 08:31
Carla McKinney
You’re all missing the point. FAERS data is statistically meaningless without population denominators. You’re reading anecdotal noise as signal. The FDA knows this. That’s why they don’t publish usage numbers. This isn’t transparency - it’s manipulation. People will panic over 50 reports of ‘headache’ when 5 million people took the drug. This post is dangerously naive.
February 25, 2026 at 17:34
Ojus Save
cool post but i think u forgot to mention that the dashboard sometimes lags. i tried to search for insulin and it gave me 2022 data. had to go to the raw files. also typo in ‘lactic acidosus’ lol
February 26, 2026 at 18:26
Jack Havard
FAERS is a government trap. They collect this data to make you think they’re watching out for you. But the real agenda? To normalize drug surveillance. Next thing you know, your EHR will be auto-flagged if you report a side effect. This isn’t transparency - it’s behavioral control. I’ve seen the documents. They’re planning to link this to insurance premiums. Don’t be fooled.
February 27, 2026 at 05:14